Page 309 - Learnwell EVS
P. 309
ns
Burns
B urns are cutaneo us lesio ns caused by exp o sure to h eat, electricity , ch em icals o r
rad iatio n. T hey cause significant p ain and m ay threaten survival and / o r co m p ro m ise
functio n.
Classification of burns
Severe burns: o ne o r m o re o f the fo llo wing p aram eters:
– I nvo lving m o re th an 1 0 % o f th e bo d y surface area ( B S A ) in child ren and 1 5 % in
ad ults
– Inhalatio n injury (sm o k e, ho t air, p articles, to xic gas, etc.)
– M ajo r co nco m itant traum a (fracture, head injury , etc.)
– L o catio n: face, hand s, neck , genitalia/ p erineum , jo ints (risk o f functio nal d eficit)
– E lectrical and chem ical burns o r burns d ue to exp lo sio ns
– A ge < 3 y ears o r > 6 0 y ears o r significant co -m o rbid ities (e.g. ep ilep sy , m alnutritio n)
Minor burns: invo lving less than 1 0 % o f the B S A in child ren and 1 5 % in ad ults, in the
absence o f o ther risk facto rs.
Evaluation of burns
Extent of burns
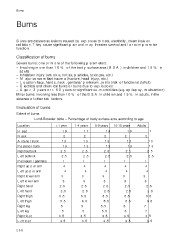
Lund-Browder table – Percentage of body surface area according to age
Location < 1 year 1-4 years 5-9 years 10-15 years Adults
H ead 19 17 13 10 7
N eck 2 2 2 2 2
A nterio r trunk 13 13 13
P o sterio r trunk 13 13 13 13 13
Right butto ck 2 .5 2 .5 2 .5 13 13
L eft butto ck 2 .5 2 .5 2 .5 2 .5 2 .5
P erineum / genitalia 1 1 1 2 .5 2 .5
Right up p er arm 4 4 4 1 1
L eft up p er arm 4 4 4 4 4
Right lo wer arm 3 3 3 4 4
L eft lo wer arm 3 3 3 3 3
Right hand 2 .5 2 .5 2 .5 3 3
L eft hand 2 .5 2 .5 2 .5 2 .5 2 .5
Right thigh 5 .5 6 .5 8 .5 2 .5 2 .5
L eft thigh 5 .5 6 .5 8 .5 8 .5 9 .5
Right leg 5 5 5 .5 8 .5 9 .5
L eft leg 5 5 5 .5 6 7
Right fo o t 3 .5 3 .5 3 .5 6 7
L eft fo o t 3 .5 3 .5 3 .5 3 .5 3 .5
3 .5 3 .5
266
Burns
B urns are cutaneo us lesio ns caused by exp o sure to h eat, electricity , ch em icals o r
rad iatio n. T hey cause significant p ain and m ay threaten survival and / o r co m p ro m ise
functio n.
Classification of burns
Severe burns: o ne o r m o re o f the fo llo wing p aram eters:
– I nvo lving m o re th an 1 0 % o f th e bo d y surface area ( B S A ) in child ren and 1 5 % in
ad ults
– Inhalatio n injury (sm o k e, ho t air, p articles, to xic gas, etc.)
– M ajo r co nco m itant traum a (fracture, head injury , etc.)
– L o catio n: face, hand s, neck , genitalia/ p erineum , jo ints (risk o f functio nal d eficit)
– E lectrical and chem ical burns o r burns d ue to exp lo sio ns
– A ge < 3 y ears o r > 6 0 y ears o r significant co -m o rbid ities (e.g. ep ilep sy , m alnutritio n)
Minor burns: invo lving less than 1 0 % o f the B S A in child ren and 1 5 % in ad ults, in the
absence o f o ther risk facto rs.
Evaluation of burns
Extent of burns
Lund-Browder table – Percentage of body surface area according to age
Location < 1 year 1-4 years 5-9 years 10-15 years Adults
H ead 19 17 13 10 7
N eck 2 2 2 2 2
A nterio r trunk 13 13 13
P o sterio r trunk 13 13 13 13 13
Right butto ck 2 .5 2 .5 2 .5 13 13
L eft butto ck 2 .5 2 .5 2 .5 2 .5 2 .5
P erineum / genitalia 1 1 1 2 .5 2 .5
Right up p er arm 4 4 4 1 1
L eft up p er arm 4 4 4 4 4
Right lo wer arm 3 3 3 4 4
L eft lo wer arm 3 3 3 3 3
Right hand 2 .5 2 .5 2 .5 3 3
L eft hand 2 .5 2 .5 2 .5 2 .5 2 .5
Right thigh 5 .5 6 .5 8 .5 2 .5 2 .5
L eft thigh 5 .5 6 .5 8 .5 8 .5 9 .5
Right leg 5 5 5 .5 8 .5 9 .5
L eft leg 5 5 5 .5 6 7
Right fo o t 3 .5 3 .5 3 .5 6 7
L eft fo o t 3 .5 3 .5 3 .5 3 .5 3 .5
3 .5 3 .5
266